September 19, 2026
CRM KPIs Every Business Should Track: 30 Key Metrics
CRM KPIs Every Business Should Track CRM KPIs every bu...
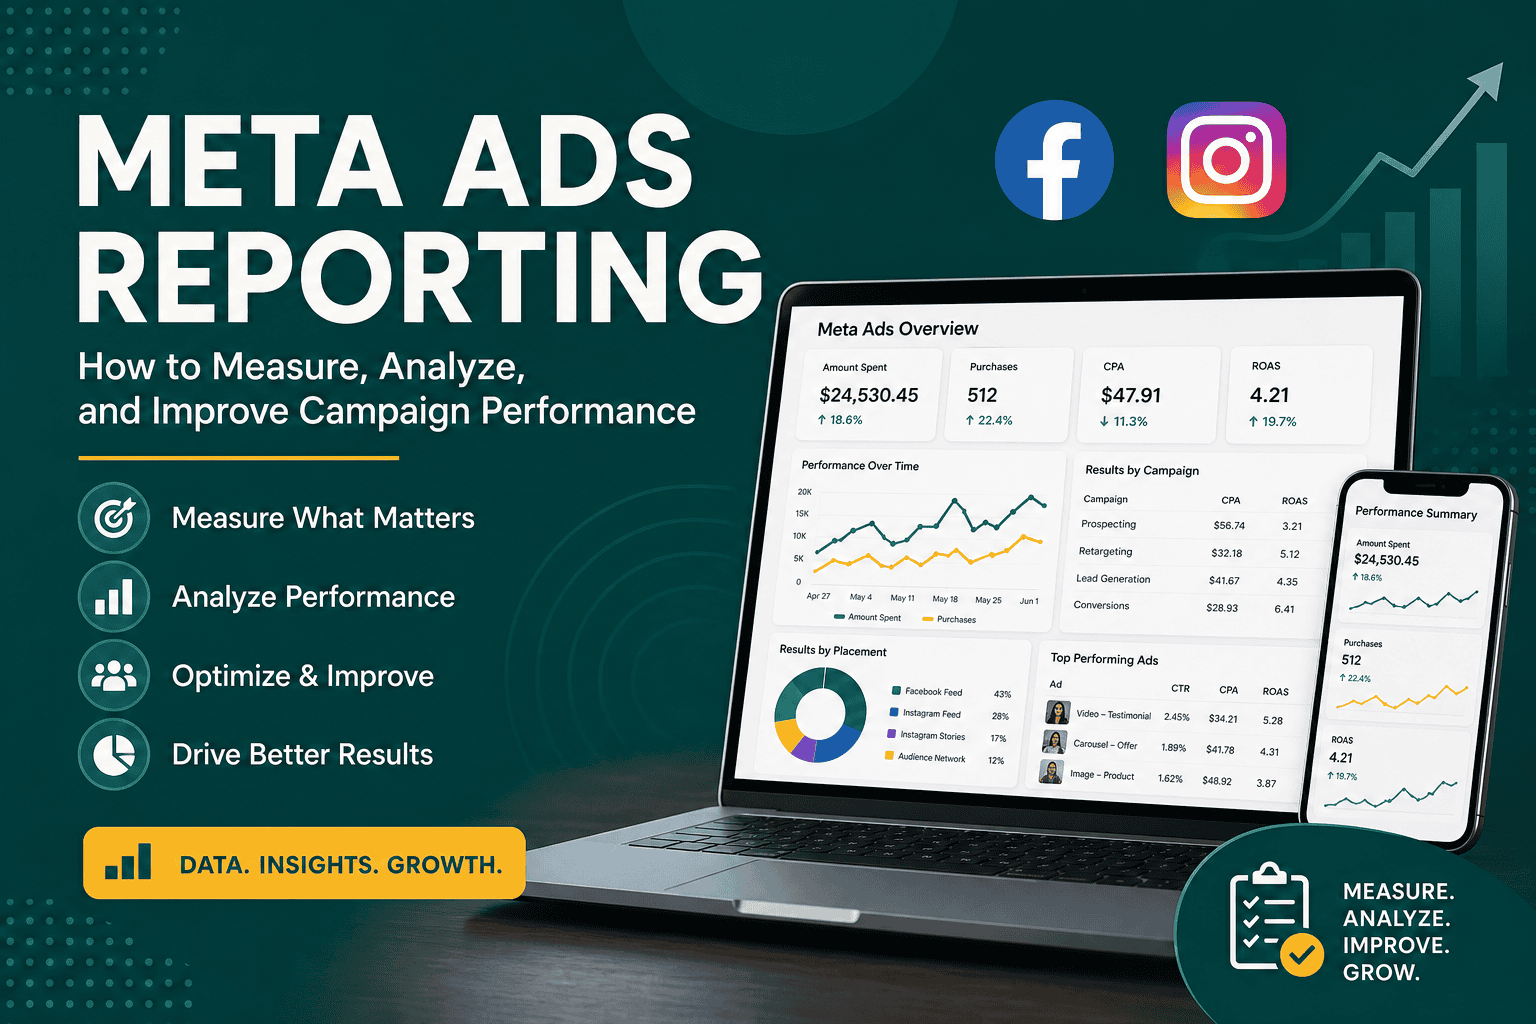
Meta ads reporting is the process of tracking, organizing, and interpreting performance data from Facebook and Instagram advertising campaigns. A strong reporting system helps you understand what is working, what is wasting budget, and where to make smarter optimization decisions.
Whether you manage campaigns for an ecommerce brand, local business, SaaS company, or agency client, Meta ads reporting should go beyond surface-level numbers. Instead of only looking at impressions, clicks, and spend, effective reporting connects ad performance to business outcomes such as leads, purchases, revenue, customer acquisition cost, and return on ad spend.
Meta ads reporting refers to the collection and analysis of advertising data from Meta Ads Manager, which includes campaigns running across Facebook, Instagram, Messenger, Audience Network, and other Meta placements. Reports can be created directly inside Ads Manager or exported into spreadsheets, dashboards, CRM systems, and analytics platforms.
The goal is not just to document what happened. The goal is to identify patterns, explain performance changes, and guide future decisions. Good reporting answers questions such as:
Meta advertising can produce excellent results, but without clear reporting, it is easy to misinterpret performance. A campaign may have a high click-through rate but poor conversion quality. Another campaign may have a higher cost per click but generate better customers. Reporting helps separate vanity metrics from meaningful business performance.
Accurate reporting is especially important because Meta’s algorithm uses conversion signals, audience behavior, and campaign objectives to optimize delivery. If your reporting is incomplete or disconnected from your sales process, you may make decisions based on partial data.
Meta ads reporting helps advertisers decide where to increase, reduce, or pause spending. If one campaign consistently delivers a lower cost per acquisition and higher return on ad spend, it may deserve more budget. If another campaign spends heavily without producing qualified results, it may need restructuring.
Creative is one of the biggest drivers of Meta ad performance. Reporting allows you to compare hooks, visuals, formats, offers, headlines, and calls to action. Over time, this reveals which creative themes resonate with your audience.
For lead generation campaigns, Meta Ads Manager alone does not always show lead quality. Connecting campaign data with CRM and sales outcomes gives a more complete view. Businesses using CRM platforms can benefit from understanding why teams choose systems like Salesforce for centralized customer data, automation, and analytics. A deeper look at why businesses choose Salesforce CRM shows how customer data platforms can improve reporting beyond the initial ad conversion.
The right metrics depend on your campaign objective, business model, and funnel stage. However, most Meta ads reports should include a combination of delivery, engagement, conversion, and revenue metrics.
Impressions show how many times your ads were displayed. This metric is useful for measuring visibility, but it does not indicate whether people took action.
Reach shows the number of unique people who saw your ad. Comparing reach with impressions helps determine how often the same users are seeing your ads.
Frequency is the average number of times each person saw your ad. High frequency can sometimes indicate audience fatigue, especially if click-through rate declines and cost per result increases.
CPM, or cost per thousand impressions, measures how much you pay for ad exposure. CPM can fluctuate based on audience competition, seasonality, creative quality, placements, and campaign objective.
Clicks measure interactions with your ad. Depending on your report settings, this may include link clicks, outbound clicks, or all clicks. For performance campaigns, outbound clicks or landing page views are often more meaningful than total clicks.
Click-through rate shows the percentage of impressions that resulted in clicks. A low CTR may suggest weak creative, poor audience fit, or an unclear offer.
Cost per click shows how much you pay for each click. While useful, CPC should not be analyzed alone. Cheap clicks are not valuable if they do not convert.
Landing page views indicate how many people actually loaded the destination page after clicking. If link clicks are much higher than landing page views, the page may be slow, broken, or poorly optimized for mobile users.
Since landing page speed can affect paid traffic performance, website infrastructure matters. Businesses using WordPress should consider hosting quality because slow pages can reduce conversion rates and distort ad reporting. This WordPress hosting guide for choosing the right hosting explains factors such as speed, uptime, security, and scalability that can influence the post-click experience.
Conversions are actions users take after interacting with your ad. These may include purchases, leads, registrations, add-to-cart events, checkout starts, phone calls, or custom website events.
Cost per result shows how much you spend to achieve your selected campaign objective. For example, if your campaign objective is leads, cost per result may show cost per lead.
Cost per acquisition measures how much it costs to acquire a customer or qualified conversion. This is often more important than cost per lead or cost per click because it reflects actual business value.
Return on ad spend measures revenue generated for every dollar spent on ads. For ecommerce campaigns, ROAS is one of the most important metrics, though it should be evaluated alongside profit margin, customer lifetime value, and attribution quality.
A useful reporting framework should be consistent, easy to understand, and aligned with business goals. Before building a report, define what success means for the campaign.
Start by identifying the main objective. A brand awareness campaign should not be judged the same way as a purchase campaign. Common Meta campaign objectives include:
Each objective requires different reporting priorities. For example, awareness campaigns may focus on reach, frequency, CPM, and video views, while sales campaigns should focus on conversion value, purchases, CPA, and ROAS.
Meta ads reporting becomes clearer when campaigns are grouped by funnel stage:
This prevents unfair comparisons. A prospecting campaign reaching cold audiences may naturally have a higher CPA than a retargeting campaign reaching warm visitors.
Attribution determines how Meta assigns credit for conversions. Common attribution windows include 1-day click, 7-day click, and 1-day view. Your reporting should be consistent so performance trends are comparable over time.
For short buying cycles, a shorter attribution window may be appropriate. For high-ticket products or B2B services, a longer window may better reflect the customer journey.
Meta Ads Manager shows ad-side performance, but post-click behavior often requires additional tools such as website analytics, CRM reporting, call tracking, or ecommerce analytics. This is where many advertisers discover that high-performing ads are not always producing high-quality leads or customers.
A single day of performance can be misleading. Meta ad results fluctuate due to learning phases, auction competition, audience behavior, and tracking delays. Reports should compare performance across meaningful periods such as week over week, month over month, or quarter over quarter.
Lead generation reporting should measure both quantity and quality. A low cost per lead can look attractive, but if those leads do not answer calls, book meetings, or become customers, the campaign may not be profitable.
Important lead generation metrics include:
To improve accuracy, connect Meta campaign data with CRM data. This allows you to see which campaigns, ad sets, and ads produce qualified opportunities instead of only form submissions.
Ecommerce reporting usually focuses on revenue, purchases, and profitability. However, ROAS alone can be incomplete if you do not consider margins, refunds, shipping costs, discounts, and repeat purchase behavior.
Important ecommerce metrics include:
For ecommerce brands, it is useful to compare Meta Ads Manager data with platform data from Shopify, WooCommerce, Google Analytics, or another analytics tool. Differences are normal because each platform uses different attribution models.
Likes, comments, shares, and clicks can indicate engagement, but they do not always mean profitable performance. Reports should connect engagement metrics to business results.
Meta, Google Analytics, Shopify, and CRM systems may report different conversion numbers. This does not always mean one platform is wrong. It usually means each system uses different rules for assigning credit.
Aggregated reporting can hide important insights. Prospecting, retargeting, testing, and retention campaigns should be reviewed separately.
Meta campaigns need enough data before conclusions are reliable. Pausing ads after a small amount of spend may prevent the algorithm from optimizing properly.
For service businesses and B2B campaigns, lead quality is critical. Reporting should include downstream sales metrics, not just form submissions.
A clear Meta ads report should be easy for both marketers and business stakeholders to understand. The best structure depends on the audience, but most reports should include the following sections:
The right reporting frequency depends on campaign size, spend level, and business needs. However, most advertisers benefit from a combination of daily monitoring, weekly optimization reviews, and monthly strategic reporting.
Daily checks are useful for spotting major problems such as disapproved ads, tracking issues, sudden spend spikes, or broken landing pages. Daily reporting should be light and focused on alerts, not overanalysis.
Weekly reporting is ideal for campaign optimization. This is where you review performance trends, shift budgets, evaluate creative tests, and identify underperforming ad sets.
Monthly reporting should focus on strategic insights. It should explain what happened, why it happened, and what should happen next. Monthly reports are especially useful for clients, executives, and business owners.
Accurate Meta ads reporting depends on reliable tracking and clean data. If tracking is incomplete, campaign decisions may be based on misleading numbers.
The Meta Pixel tracks website activity after users click or view ads. It should be installed on all relevant pages and configured to track important events such as page views, leads, purchases, add-to-cart actions, and completed registrations.
The Conversions API sends server-side data to Meta, helping improve tracking reliability. This is increasingly important because browser restrictions, cookie limitations, and privacy changes can reduce pixel-based tracking accuracy.
UTM parameters help identify Meta traffic in analytics platforms. A consistent UTM structure makes it easier to compare campaign performance across Meta Ads Manager, Google Analytics, CRM systems, and dashboards.
If you use CRM data in your reporting, make sure lead sources, campaign names, and lifecycle stages are consistent. When testing CRM configurations, integrations, or automation workflows, isolated environments can help prevent reporting errors. For Salesforce users, this Salesforce sandbox guide explains how sandbox environments support testing and setup without affecting live production data.
Creative reporting should evaluate more than which ad has the lowest cost per result. You should analyze the relationship between creative, audience, placement, and funnel stage.
Useful creative reporting dimensions include:
Look for repeatable patterns. If testimonial videos consistently produce higher conversion rates, that insight should influence future creative production.
When presenting reports, avoid overwhelming stakeholders with every available metric. Instead, focus on what matters to the business. A business owner usually wants to know how much was spent, what results were generated, whether performance improved, and what actions are recommended.
A strong stakeholder report should include:
The best reports tell a story. Instead of saying “CPA increased by 18%,” explain why it increased and what will be done about it. For example, higher CPA may be caused by seasonal competition, creative fatigue, audience saturation, tracking issues, or landing page conversion problems.
Use this checklist to improve the quality of your Meta ads reporting:
Meta ads reporting is essential for turning campaign data into better marketing decisions. A useful report does more than list metrics; it explains performance, identifies opportunities, and guides optimization. By tracking the right KPIs, separating campaigns by funnel stage, validating conversion data, and connecting ad performance to business outcomes, advertisers can improve efficiency and scale campaigns with greater confidence.
The strongest Meta ads reporting systems combine platform data, website analytics, CRM insights, and clear strategic interpretation. When reporting is accurate and actionable, every campaign becomes easier to evaluate, optimize, and grow.