September 9, 2026
Google Ads vs Facebook Ads: Which Is Better for Your Business?
Google Ads vs Facebook Ads: Which Platform Is Better f...
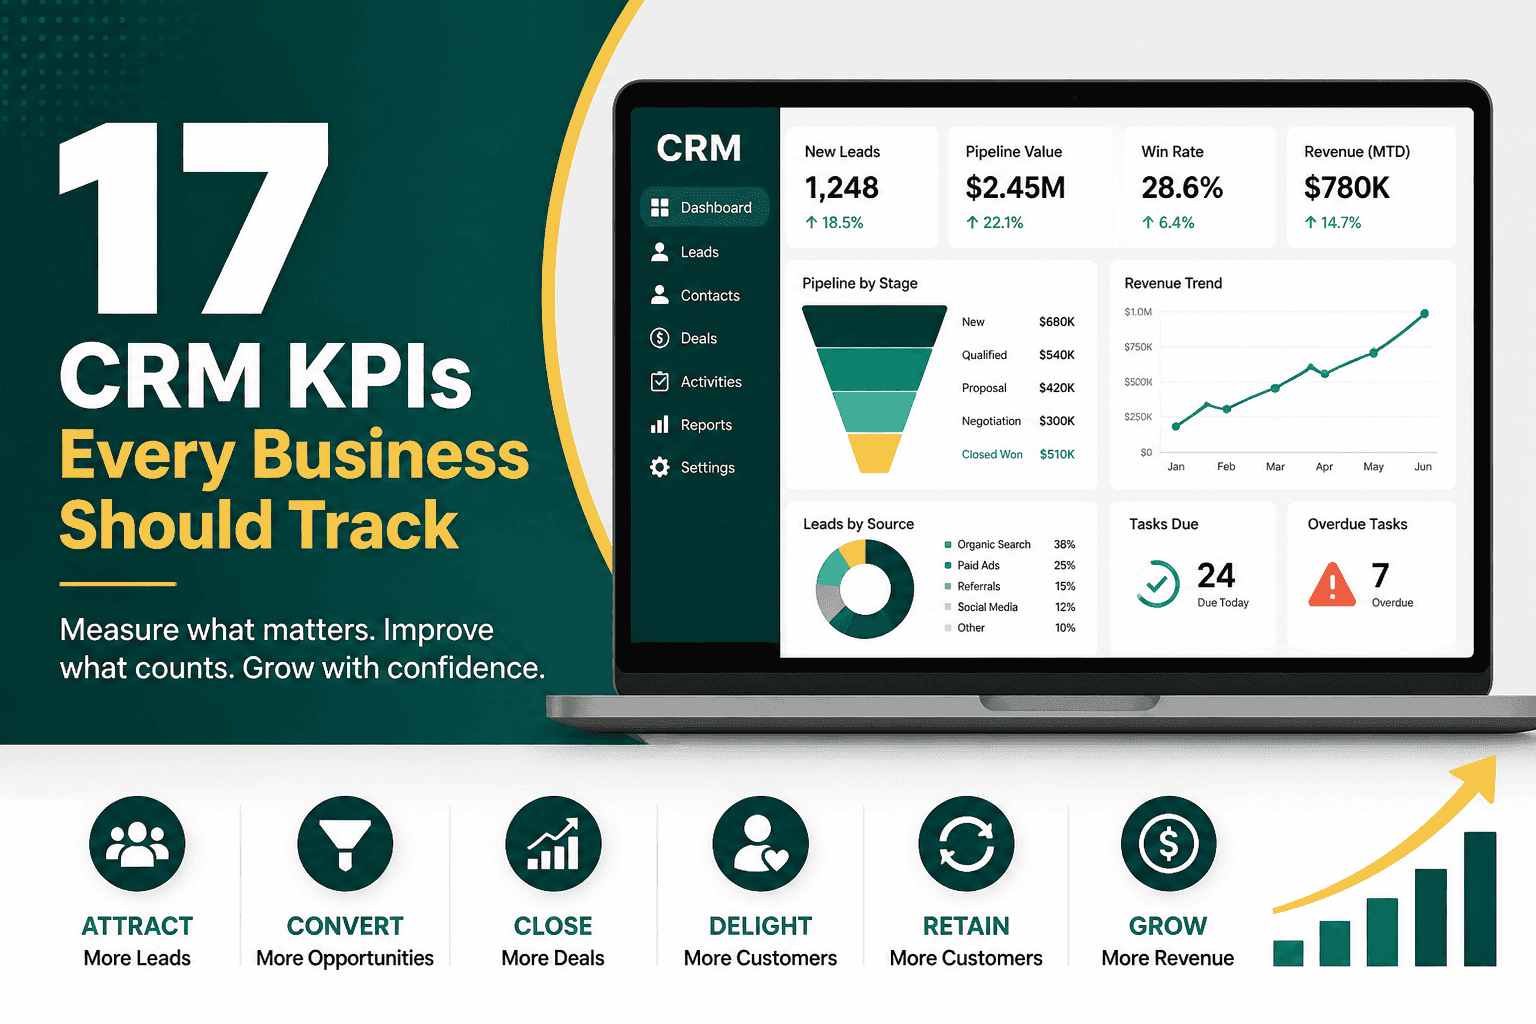
CRM KPIs every business should track are the metrics that show whether your customer relationship management system is helping your company generate leads, close deals, retain customers, improve service, and make better decisions. A CRM should not only store contact details. It should give your team clear visibility into sales performance, marketing effectiveness, customer satisfaction, operational efficiency, and revenue growth.
When businesses track the right CRM KPIs, they can identify what is working, where deals are getting stuck, which teams need support, and which customer segments create the most value. Without the right metrics, a CRM can become just another database filled with incomplete information and unused reports.
This guide explains the most important CRM KPIs every business should track, how to measure them, and how to use them to improve performance across sales, marketing, support, and management.
CRM KPIs are key performance indicators used to measure how effectively your business manages leads, prospects, customers, sales opportunities, communication, and customer relationships through your CRM system. These metrics help you understand whether your CRM is supporting business goals or simply collecting data.
Common CRM KPIs include lead conversion rate, sales cycle length, customer acquisition cost, customer lifetime value, customer retention rate, pipeline value, win rate, follow-up speed, customer satisfaction, and CRM adoption rate.
If you are still defining the role of CRM in your business, it may help to review the fundamentals of what CRM is and how it works before building your KPI framework.
CRM KPIs matter because they turn customer data into useful business insight. Instead of relying on opinions, assumptions, or scattered spreadsheets, your team can use CRM reporting to understand real performance.
Tracking CRM KPIs helps businesses:
The key is not to track every possible metric. The goal is to track the CRM KPIs that connect directly to your business objectives.
Lead volume measures how many new leads enter your CRM during a specific period. This may include website form submissions, phone inquiries, ad leads, event contacts, email signups, referrals, or manually entered prospects.
This KPI helps you understand whether your marketing and sales activities are generating enough opportunities for growth.
Lead volume is usually measured by counting new lead records created in the CRM during a selected time period.
If lead volume is too low, your sales team may not have enough opportunities to reach revenue goals. If lead volume is high but conversions are low, the issue may be lead quality, targeting, qualification, or follow-up.
Lead source performance shows which channels generate the best leads. These channels may include organic search, paid ads, social media, referrals, email marketing, events, partner campaigns, direct traffic, or outbound sales.
This CRM KPI helps your business understand where to invest more time and budget.
For example, one channel may generate a large number of leads but very few customers. Another channel may produce fewer leads but a much higher close rate. Lead source reporting helps you focus on quality, not just quantity.
Lead conversion rate measures the percentage of leads that move from one stage to another, such as from lead to qualified lead, qualified lead to opportunity, or lead to paying customer.
This is one of the most important CRM KPIs every business should track because it shows how effectively your business turns interest into revenue.
Lead Conversion Rate = Converted Leads ÷ Total Leads × 100
For example, if your business receives 500 leads in a month and 50 become customers, your lead-to-customer conversion rate is 10%.
Many businesses improve lead conversion by using automation to reduce missed follow-ups and manual delays. These CRM automation ideas can help you create a more consistent lead management process.
Marketing qualified leads, often called MQLs, are leads that meet certain engagement or fit criteria and are considered ready for further sales or nurturing activity.
An MQL might be someone who downloaded a guide, visited pricing pages, attended a webinar, or matched your ideal customer profile.
Tracking MQLs helps marketing teams measure whether they are producing leads that are meaningful for sales. It also helps sales teams focus on leads that are more likely to convert.
Your CRM should clearly define when a lead becomes an MQL so reports remain consistent.
Sales qualified leads, or SQLs, are leads that the sales team has reviewed and accepted as genuine sales opportunities. SQLs usually show stronger buying intent than MQLs.
This KPI helps measure the quality of the handoff between marketing and sales.
MQL to SQL Conversion Rate = SQLs ÷ MQLs × 100
If this number is low, marketing may be passing leads too early, lead scoring may be inaccurate, or sales may need a clearer qualification process.
Opportunity conversion rate measures how many qualified opportunities become closed deals. This KPI is especially important for sales teams that manage a structured pipeline.
Opportunity Conversion Rate = Closed-Won Opportunities ÷ Total Opportunities × 100
For example, if your sales team creates 100 opportunities and wins 25, the opportunity conversion rate is 25%.
A low opportunity conversion rate may mean the team is creating opportunities too early or struggling to close qualified prospects.
Win rate measures the percentage of deals your business wins compared to the total number of closed opportunities. It is one of the clearest indicators of sales performance.
Win Rate = Closed-Won Deals ÷ Total Closed Deals × 100
Total closed deals include both won and lost opportunities.
Win rate helps leaders understand how competitive the business is and how effectively the team converts opportunities into revenue. A rising win rate often indicates stronger qualification, better sales messaging, improved product-market fit, or more effective sales execution.
Loss rate measures the percentage of opportunities that end as closed-lost. However, the number alone is not enough. You should also track why deals are lost.
Lost reason analysis helps your team improve positioning, pricing, qualification, product development, and sales training.
Sales pipeline value measures the total potential revenue from all active opportunities in your CRM. This KPI helps businesses forecast future revenue and understand whether there are enough deals in progress to hit targets.
Pipeline Value = Sum of All Active Opportunity Values
For more accurate forecasting, businesses often use weighted pipeline value.
Weighted Pipeline Value = Deal Value × Probability of Closing
For example, a $20,000 deal with a 50% probability has a weighted value of $10,000.
Pipeline stage conversion rate measures how effectively opportunities move from one sales stage to the next. This KPI helps identify bottlenecks in the sales process.
If many deals move from discovery to proposal but few move from proposal to negotiation, your proposals may need improvement. If deals stall at qualification, the sales team may need better discovery questions.
Sales cycle length measures how long it takes to close a deal from first contact or opportunity creation to closed-won.
Average Sales Cycle Length = Total Number of Days to Close Deals ÷ Number of Closed-Won Deals
A shorter sales cycle usually means faster revenue generation. However, the ideal sales cycle depends on your business model, deal size, industry, and buyer journey.
Well-designed workflows can help reduce delays between pipeline stages. These CRM workflow examples show how automation can support sales, marketing, and customer service processes.
Average deal size measures the average revenue value of closed-won deals. This KPI helps with sales forecasting, revenue planning, and account segmentation.
Average Deal Size = Total Closed-Won Revenue ÷ Number of Closed-Won Deals
If your average deal size is increasing, your team may be selling to better-fit customers, improving upsells, or moving upmarket. If it is decreasing, you may need to review pricing, discounting, targeting, or sales strategy.
Revenue forecast accuracy measures how close your predicted revenue is to actual closed revenue. CRM data should help leaders make reliable forecasts, but this depends on accurate pipeline data.
Accurate forecasting supports hiring, budgeting, inventory planning, cash flow management, and growth decisions. Poor forecasting can lead to missed targets, overhiring, underinvestment, or resource shortages.
Customer acquisition cost, or CAC, measures how much your business spends to acquire a new customer. This can include marketing spend, sales salaries, software costs, agency fees, advertising costs, and related expenses.
CAC = Total Sales and Marketing Cost ÷ Number of New Customers Acquired
For example, if your business spends $50,000 on sales and marketing in a quarter and acquires 100 customers, your CAC is $500.
CAC shows whether your growth is efficient. A business may generate many customers, but if the cost to acquire them is too high, profitability can suffer.
Customer lifetime value, or CLV, measures the total revenue or profit a customer is expected to generate over the entire relationship with your business.
CLV = Average Purchase Value × Purchase Frequency × Average Customer Lifespan
CLV helps you understand how much you can afford to spend on customer acquisition. A healthy business model usually has customer lifetime value significantly higher than customer acquisition cost.
CLV to CAC Ratio = Customer Lifetime Value ÷ Customer Acquisition Cost
Many businesses aim for a CLV to CAC ratio of at least 3:1, although the ideal benchmark depends on your industry and business model.
Customer retention rate measures the percentage of customers your business keeps over a specific period. This is one of the most important CRM KPIs for subscription businesses, service providers, ecommerce brands, and companies with repeat buyers.
Retention Rate = Ending Customers − New Customers ÷ Starting Customers × 100
For example, if you started with 500 customers, gained 80 new customers, and ended with 520 customers, your retention rate would be 88%.
Retaining existing customers is often more profitable than constantly acquiring new ones. Strong retention usually means customers are satisfied, seeing value, and willing to continue the relationship.
Churn rate measures the percentage of customers who stop buying, cancel a subscription, or end their relationship with your business during a specific period.
Churn Rate = Lost Customers ÷ Starting Customers × 100
High churn can indicate problems with onboarding, product fit, service quality, pricing, communication, or customer expectations.
Repeat purchase rate measures how many customers buy from your business more than once. This KPI is especially valuable for ecommerce, retail, professional services, and recurring service businesses.
Repeat Purchase Rate = Customers Who Purchased More Than Once ÷ Total Customers × 100
A high repeat purchase rate suggests strong customer satisfaction, effective follow-up, and good product or service fit.
Upsell revenue comes from selling a higher-value version of a product or service. Cross-sell revenue comes from selling related products or services to existing customers.
Your CRM should help you identify customers who may be ready for additional offerings based on purchase history, usage, lifecycle stage, support activity, or account profile.
Customer satisfaction score, or CSAT, measures how satisfied customers are with a specific experience, such as a support interaction, purchase, onboarding process, or service delivery.
CSAT = Positive Responses ÷ Total Responses × 100
CSAT surveys often ask a question such as, “How satisfied were you with your experience?” Customers typically respond using a rating scale.
CSAT gives your team direct feedback on customer experience. When connected to CRM records, satisfaction data can help account managers, support teams, and leadership spot patterns and act quickly.
Net Promoter Score, or NPS, measures how likely customers are to recommend your business to others. It is commonly used to assess loyalty and long-term customer sentiment.
Customers are asked: “How likely are you to recommend our company to a friend or colleague?” They respond on a scale from 0 to 10.
NPS = Percentage of Promoters − Percentage of Detractors
Tracking NPS in your CRM helps your team identify happy customers for referrals, reviews, testimonials, case studies, and expansion opportunities. It also helps identify unhappy customers before they churn.
First response time measures how long it takes your team to respond to a new lead, customer inquiry, or support request. This KPI applies to both sales and customer service.
Fast response times can significantly improve conversion rates and customer satisfaction, especially when prospects are comparing multiple providers.
Follow-up completion rate measures whether your team completes scheduled calls, emails, meetings, and tasks on time. This CRM KPI is important because many sales and customer experience issues happen when follow-up is missed.
Follow-Up Completion Rate = Completed Follow-Ups ÷ Scheduled Follow-Ups × 100
If follow-up completion is low, your CRM may need better reminders, task ownership, automation, or dashboard visibility.
Activity metrics track the actions sales, marketing, and service teams complete inside the CRM. These may include calls, emails, meetings, notes, proposals, demos, tasks, or support responses.
Activity metrics should not be used alone to judge performance. More activity does not always mean better outcomes. However, when combined with conversion and revenue metrics, activity data can reveal what actions lead to results.
CRM adoption rate measures how consistently your team uses the CRM. Even the best CRM system will fail if users do not enter data, update records, log activities, or follow the agreed process.
Low adoption often means the CRM is too complicated, poorly customized, lacking user training, or not aligned with daily workflows. Practical CRM customization tips can help you build a system your team is more likely to use consistently.
Data quality measures how accurate, complete, consistent, and current your CRM data is. Poor data quality leads to unreliable reports, weak personalization, duplicate records, bad forecasting, and inefficient sales activity.
Data quality should be monitored regularly because CRM reporting is only as reliable as the information entered into the system.
Support ticket volume measures how many customer service requests your business receives during a given period. This KPI helps support leaders plan staffing, identify product issues, and understand customer needs.
A sudden increase in ticket volume may indicate a product issue, unclear communication, billing problem, website issue, or service delivery gap.
Average resolution time measures how long it takes to fully resolve a customer issue. This KPI is important for customer satisfaction and support team efficiency.
Average Resolution Time = Total Time to Resolve Tickets ÷ Number of Resolved Tickets
Shorter resolution times usually improve customer experience, but speed should not come at the expense of quality. The goal is to resolve issues accurately and efficiently.
A customer health score is a composite CRM metric that estimates the strength or risk level of a customer relationship. It is often used in SaaS, account management, B2B services, and subscription businesses.
Customer health scores can help teams prioritize outreach, prevent churn, and identify expansion opportunities.
Return on CRM investment measures whether the CRM is delivering more value than it costs. CRM costs may include software licenses, implementation, customization, integrations, training, support, and maintenance.
CRM ROI = Net Gain from CRM ÷ CRM Cost × 100
Benefits may include increased revenue, improved retention, reduced manual work, faster sales cycles, better reporting, fewer errors, and higher productivity.
If you are comparing platforms or evaluating whether your current CRM supports your goals, this guide to Salesforce vs HubSpot can help you understand how different CRM systems fit different business needs.
Not every business needs to track every CRM KPI. The right KPIs depend on your goals, sales process, customer journey, and business model.
Tracking CRM KPIs is only useful if the reports are accurate, easy to understand, and connected to action. A dashboard full of numbers will not help unless your team knows what each metric means and what to do next.
Start with your business objectives. If your goal is revenue growth, focus on pipeline, win rate, deal size, and conversion metrics. If your goal is retention, focus on churn, satisfaction, customer health, and renewal metrics.
Everyone should understand how each KPI is calculated. For example, define what counts as a qualified lead, when an opportunity should be created, and what qualifies as a closed-won deal.
A good CRM dashboard should focus on the most important metrics for each role. Sales reps, managers, executives, marketers, and support teams usually need different views.
CRM reporting should be part of your regular operating rhythm. Review key metrics weekly, monthly, and quarterly depending on the nature of the KPI.
A single month of data may not tell the full story. Look at trends over time to understand whether performance is improving, declining, or staying flat.
If users do not enter accurate data, your reports will be unreliable. Use required fields, validation rules, automation, integrations, and training to improve data quality.
Manual reporting is time-consuming and prone to errors. CRM dashboards, automated alerts, scheduled reports, and workflow automation help teams act faster and more consistently.
For businesses improving broader operations beyond CRM, a strong business process automation strategy can help connect systems, reduce manual work, and create more reliable reporting.
Many businesses track CRM metrics but fail to get meaningful value from them. Avoiding common mistakes can make your reporting more useful and actionable.
Too many metrics can create confusion. Focus on the numbers that directly support your business goals.
If records are incomplete, duplicated, or outdated, your KPI reports may be misleading. Data quality should be treated as an ongoing process.
If your team does not use the CRM correctly, your reports will not reflect reality. Adoption is one of the most important CRM success factors.
Calls, emails, and meetings matter, but they should be connected to results such as conversions, revenue, retention, or customer satisfaction.
CRM KPIs should lead to decisions. If a report shows slow follow-up, poor conversion, high churn, or weak pipeline coverage, the next step should be clear.
The review frequency depends on the KPI. Some metrics should be watched daily, while others are better reviewed monthly or quarterly.
The CRM KPIs every business should track are the metrics that reveal how well your company attracts leads, converts opportunities, serves customers, retains accounts, and grows revenue. The most valuable CRM reporting does not simply show what happened. It helps your team understand why it happened and what to improve next.
Start with a focused set of KPIs tied to your business goals. Make sure your CRM data is accurate, your dashboards are easy to understand, and your team reviews the numbers consistently. Over time, the right CRM KPIs can help you improve sales performance, customer experience, marketing ROI, and operational efficiency.
A CRM becomes far more powerful when it is treated as a performance management system, not just a contact database. By tracking the right metrics and acting on the insights, your business can build stronger customer relationships and make smarter growth decisions.