July 13, 2026
WordPress Hosting Guide: Choose the Best Hosting in 2026
WordPress Hosting Guide: How to Choose the Right Hosti...
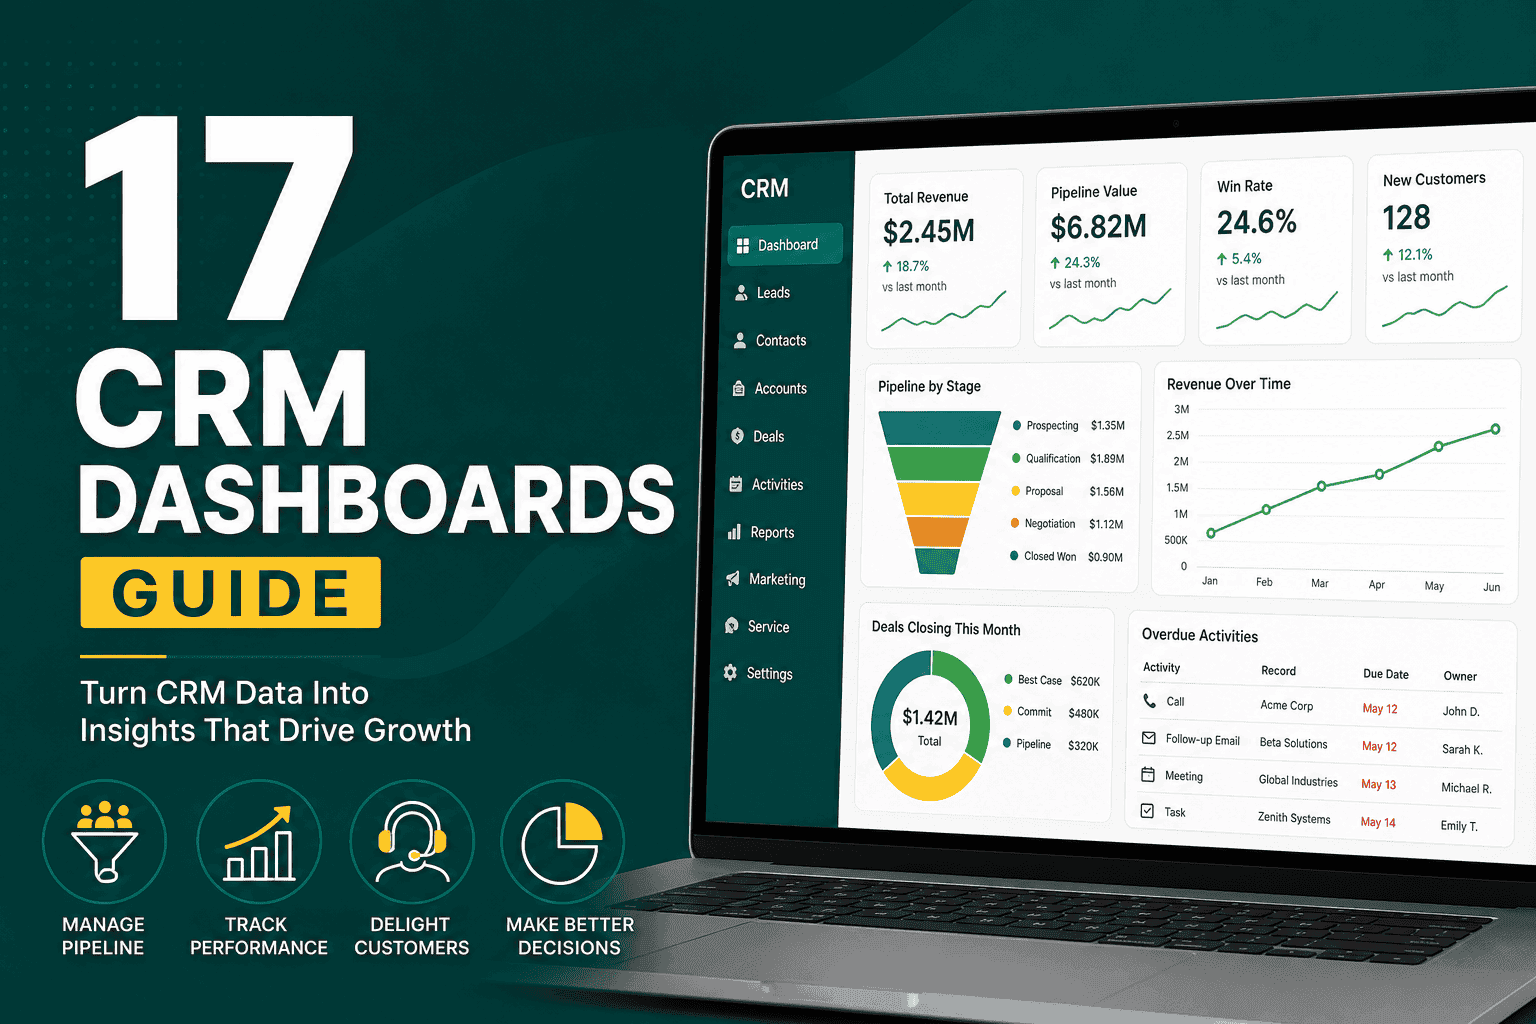
A practical CRM dashboards guide helps businesses turn customer, sales, marketing, and service data into clear, actionable insights. A CRM dashboard is a visual reporting tool inside your customer relationship management system that shows key metrics, trends, activities, and performance indicators in one place. Instead of digging through spreadsheets, reports, emails, and individual records, teams can use dashboards to understand what is happening, what needs attention, and where opportunities exist.
CRM dashboards are useful for sales managers, marketing teams, executives, customer service leaders, operations teams, and individual reps. When built correctly, they help teams track pipeline health, lead quality, sales activity, customer retention, support performance, forecast accuracy, campaign results, and business growth. When built poorly, they become cluttered screens filled with vanity metrics that nobody uses.
This CRM dashboards guide explains what CRM dashboards are, why they matter, which dashboards your business may need, what metrics to include, and how to build dashboards that support better decisions.
A CRM dashboard is a visual summary of important customer relationship management data. It usually includes charts, numbers, tables, progress bars, filters, and activity summaries connected to your CRM records. These records may include leads, contacts, accounts, deals, opportunities, service cases, tasks, calls, emails, meetings, campaigns, and customer interactions.
The purpose of a CRM dashboard is to make CRM data easier to understand. Instead of reviewing hundreds or thousands of individual records, users can quickly see patterns and priorities. For example, a sales manager can see how much pipeline exists for the month, which deals are at risk, which reps are behind on follow-up, and whether the team is likely to hit target.
If you are still clarifying the role of CRM in your business, it may help to start with this overview of what CRM is and how it works. Dashboards are most valuable when they are connected to a well-structured CRM strategy.
CRM dashboards matter because they help businesses move from reactive decision-making to proactive management. Without dashboards, teams often rely on manual updates, scattered spreadsheets, incomplete reports, or assumptions. This makes it harder to manage sales performance, customer experience, marketing effectiveness, and operational efficiency.
Well-designed CRM dashboards help businesses:
Dashboards also support CRM adoption. When users can see useful insights inside the system, they are more likely to keep data updated and use the CRM consistently.
Different teams need different dashboard views. A CEO does not need the same level of detail as a sales rep. A marketing manager needs different metrics than a support manager. The best CRM dashboard setup usually includes several focused dashboards instead of one overloaded dashboard.
An executive CRM dashboard gives leadership a high-level view of business performance. It should focus on outcomes, trends, risks, and strategic priorities rather than day-to-day activity details.
Common executive dashboard metrics include:
This dashboard should help executives answer questions such as: Are we on track to hit revenue goals? Which business areas are growing? Where are we losing customers? Which channels or teams need attention?
A sales pipeline dashboard shows the status of open opportunities and helps sales leaders manage revenue generation. This is one of the most important CRM dashboards for sales-driven businesses.
Useful pipeline metrics include:
This dashboard helps managers identify whether the pipeline is healthy, whether enough opportunities are being created, and whether deals are moving forward at the right pace.
A sales activity dashboard tracks the actions sales reps take to move leads and deals forward. While activity does not always equal results, tracking activity helps managers understand effort, consistency, and follow-up discipline.
Examples of sales activity metrics include:
This type of dashboard is especially useful for teams that depend on outbound sales, inbound lead follow-up, appointment setting, or account management.
A lead management dashboard helps teams understand where leads are coming from, how quickly they are being contacted, and how effectively they convert into opportunities or customers.
Important lead dashboard metrics include:
If your CRM is connected to advertising platforms, forms, email marketing tools, or landing pages, this dashboard can show which channels are producing real business opportunities instead of just raw lead volume.
A marketing CRM dashboard connects campaign activity to leads, opportunities, customers, and revenue. This is important because marketing performance should not only be judged by clicks, impressions, or form fills.
Useful marketing dashboard metrics include:
A strong CRM dashboard can support a broader digital marketing strategy by showing which channels attract the right customers and which campaigns need improvement.
A customer service CRM dashboard helps support teams manage cases, tickets, requests, complaints, and customer satisfaction. It gives managers visibility into workload, response quality, and service performance.
Common service dashboard metrics include:
This dashboard helps service leaders prevent backlogs, improve customer experience, and identify recurring product or process problems.
A customer retention dashboard focuses on whether customers continue doing business with your company. This is especially important for SaaS, subscription businesses, agencies, service providers, ecommerce companies, and B2B companies with repeat customers.
Useful retention metrics include:
Retention dashboards help teams protect revenue, prioritize customer success, and identify accounts that need attention before they leave.
A CRM data quality dashboard tracks the health of the data inside your CRM. This is often overlooked, but poor data quality can damage reporting, automation, segmentation, forecasting, and customer communication.
Data quality metrics may include:
This dashboard is useful for CRM admins, sales operations teams, marketing operations teams, and managers who depend on accurate reporting.
The best CRM dashboard metrics depend on your business model, sales process, customer journey, and goals. However, most companies should consider tracking a mix of revenue, pipeline, activity, marketing, service, and customer metrics.
Some of the most useful CRM dashboard metrics include:
For a deeper list of important CRM measurements, review these CRM KPIs every business should track. Your dashboards should be built around the KPIs that directly support your business goals.
Building an effective CRM dashboard is not just a technical task. It requires understanding what the business needs to know, who will use the dashboard, how decisions are made, and whether the underlying CRM data is reliable.
Start by asking what decision the dashboard should support. A dashboard without a clear purpose usually becomes cluttered. For example, a sales manager dashboard may be designed to answer: Which deals need attention this week? An executive dashboard may answer: Are we on track to hit quarterly revenue goals?
Common dashboard purposes include:
Every dashboard should be designed for a specific audience. Executives need summaries and trends. Managers need performance breakdowns and exceptions. Individual users need task-level and record-level visibility.
Before building a dashboard, define who will use it:
The dashboard layout, filters, and level of detail should match the user’s responsibilities.
A common CRM dashboard mistake is adding too many metrics. More data does not always create better insight. A dashboard should focus on the few metrics that matter most for the user’s role and goal.
For example, a sales rep may need to see assigned leads, today’s tasks, open deals, overdue follow-ups, and personal quota progress. They do not need a full company revenue analysis every time they log in.
A dashboard is only as useful as the data behind it. If users do not update deal stages, close dates, lead statuses, or activity records, the dashboard will become unreliable.
To improve dashboard accuracy, make sure your CRM has:
CRM customization can also improve reporting quality. These CRM customization tips explain how to structure your system so it better supports users, workflows, and reporting.
Good dashboard design helps users understand information quickly. Place the most important metrics at the top. Use charts when they clarify trends, but avoid unnecessary visuals that make the dashboard harder to read.
Helpful dashboard design practices include:
Filters make dashboards more useful because users can adjust the view without creating separate reports for every question. Common CRM dashboard filters include date range, sales rep, team, region, lead source, campaign, product, deal stage, customer type, and priority level.
Time periods are especially important. A dashboard should make it easy to compare this month, last month, this quarter, last quarter, year to date, and custom date ranges.
The best dashboards do not only show performance; they help users take action. For example, a dashboard can include a list of overdue follow-ups, deals with no next step, leads not contacted within 24 hours, or support cases approaching SLA breach.
Action-oriented dashboard sections may include:
CRM dashboards should evolve as your business changes. A dashboard that was useful during early growth may not be enough when you add new products, new sales teams, new markets, or more complex customer journeys.
Review dashboards regularly and ask users:
Then simplify, refine, or expand dashboards based on real usage.
Different roles need different dashboards. Below are practical examples of dashboards based on common business roles.
A sales manager dashboard should help managers coach reps, manage pipeline, and identify revenue risks.
A sales rep dashboard should help individual users focus on daily priorities and personal performance.
A marketing manager dashboard should show whether campaigns are generating quality leads, pipeline, and revenue.
A customer service manager dashboard should reveal support workload, team performance, and customer satisfaction.
An executive dashboard should focus on strategic business health instead of operational detail.
To get the most value from your dashboards, follow these CRM dashboard best practices.
One dashboard should not try to serve every department and every user. Focus each dashboard around a specific role, goal, or process. This makes dashboards easier to understand and more likely to be used.
A metric belongs on a dashboard if someone can use it to make a decision or take action. If a number looks interesting but does not influence behavior, it may not deserve dashboard space.
Everyone should agree on what metrics mean. For example, define what counts as a qualified lead, an active opportunity, a closed deal, a retained customer, or an at-risk account. Inconsistent definitions create confusion and reduce trust in the dashboard.
Lagging indicators show what already happened, such as closed revenue or churn. Leading indicators help predict future performance, such as new meetings booked, proposal volume, pipeline created, or lead response time. A strong CRM dashboard includes both.
Users should be able to scan a dashboard quickly and understand what matters. Avoid dense layouts, unnecessary charts, unclear labels, or too many competing visuals.
Dashboards become more useful when they reflect how your team actually works. For example, if your sales process has defined stages, your pipeline dashboard should match those stages. If customer service uses case priorities, your support dashboard should show cases by priority.
Many useful dashboards become even more powerful when paired with reminders, task creation, alerts, and automated follow-up. These CRM automation ideas can help you connect dashboard insights to actions that save time and improve performance.
CRM dashboards can fail when they are poorly planned or disconnected from real business needs. Avoid these common mistakes.
Too many metrics make dashboards difficult to use. Users may stop paying attention if they cannot quickly identify what matters. Start with the most important metrics, then add more only when needed.
If CRM records are incomplete or outdated, dashboard results will be misleading. A pipeline dashboard is not useful if close dates, deal values, and stages are not maintained.
Dashboards should be designed with the people who will actually use them. Ask managers, reps, executives, and support teams what decisions they need to make and what information they currently struggle to find.
Activity metrics are useful, but they should not be the only measurement. A sales rep may make many calls without generating quality opportunities. Combine activity data with outcomes such as conversion rates, revenue, and customer retention.
Someone must be responsible for keeping data accurate. If nobody owns CRM data quality, dashboards eventually lose credibility.
Business priorities change. Dashboards should be reviewed periodically to stay relevant and useful.
Use this checklist when planning or improving your CRM dashboards:
Most modern CRM platforms include dashboard and reporting features. Salesforce, HubSpot, Zoho CRM, Microsoft Dynamics, Pipedrive, Monday CRM, and other systems all provide different ways to visualize CRM data.
The right CRM dashboard setup depends on your platform and business complexity. Salesforce often supports highly customizable reporting for complex organizations. HubSpot is usually easier for small and mid-sized teams that want built-in sales and marketing reporting. Simpler CRMs may offer fewer customization options but can still provide useful dashboards for pipeline, activity, and lead tracking.
If you are evaluating platforms, this comparison of Salesforce vs HubSpot can help you understand which CRM may better support your reporting, customization, automation, and growth needs.
CRM dashboards support business growth by helping teams focus on the right priorities. They make problems visible earlier, highlight opportunities faster, and create accountability across departments.
For example, a lead response dashboard can reveal that leads are waiting too long for follow-up. A pipeline dashboard can show that deals are getting stuck at the proposal stage. A retention dashboard can reveal that customers with low engagement are more likely to churn. A marketing dashboard can show that one campaign generates many leads but few qualified opportunities.
These insights help businesses improve processes, coach teams, adjust strategy, and invest in the channels and activities that produce better results. For a broader view of how CRM supports growth, explore the benefits of CRM for businesses.
A strong CRM dashboard turns raw customer data into useful business intelligence. It helps teams understand performance, prioritize work, improve follow-up, manage pipeline, measure marketing effectiveness, support customers, and make better decisions.
The key is to build dashboards with a clear purpose. Focus on the right audience, choose meaningful metrics, maintain clean CRM data, and design dashboards around action. Avoid clutter, vanity metrics, and one-size-fits-all reporting.
When your CRM dashboards are accurate, focused, and connected to real business goals, they become more than reports. They become a daily management tool for improving sales, marketing, service, customer retention, and long-term growth.